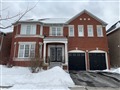
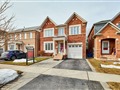
23 Seggar Ave
$1,559,836
Comparative Market Analysis
Jul 11, 2025
NOT AN ACTIVE LISTING
Historical Performance
| Period | $ Change | % Change |
| 1 Day | +$432 | +0.028% |
| 7 Days | +$368 | +0.024% |
| 30 Days | -$2,254 | -0.144% |
| 3 Months | -$2,779 | -0.178% |
| 6 Months | +$29.5k | +1.93% |
| 1 Year | -$63.2k | -3.89% |
| 3 Years | +$313k | +25.1% |
| 5 Years | +$526k | +50.9% |
| 10 Years | +$961k | +161% |
List My Property
Real Estate Statistics
Financing Solutions
AS SEEN ON


Are You a Licensed Real Estate Agent or Broker?