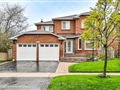
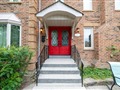
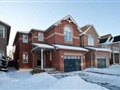
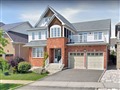
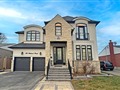
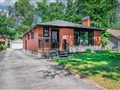
32 Leach Dr
$882,339
Comparative Market Analysis
Jul 6, 2025
NOT AN ACTIVE LISTING
Historical Performance
| Period | $ Change | % Change |
| 1 Day | +$253 | +0.029% |
| 7 Days | +$136 | +0.015% |
| 30 Days | -$1,713 | -0.194% |
| 3 Months | -$3,142 | -0.355% |
| 6 Months | +$13.3k | +1.53% |
| 1 Year | -$43.4k | -4.69% |
| 3 Years | +$143k | +19.3% |
| 5 Years | +$270k | +44.0% |
| 10 Years | +$477k | +118% |
List My Property
Real Estate Statistics
Financing Solutions
Browsing History
26 Leach Dr, Ajax
5 seconds ago
20 Fearn Cres, Ajax
9 seconds ago
AS SEEN ON


Are You a Licensed Real Estate Agent or Broker?