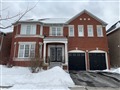
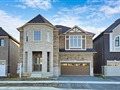
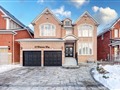
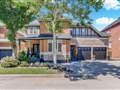
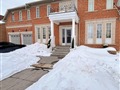
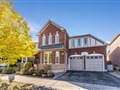
43 Selby Dr
$1,272,986
Comparative Market Analysis
Jun 6, 2025
NOT AN ACTIVE LISTING
Historical Performance
| Period | $ Change | % Change |
| 1 Day | +$353 | +0.028% |
| 7 Days | +$222 | +0.017% |
| 30 Days | -$2,227 | -0.175% |
| 3 Months | -$3,556 | -0.279% |
| 6 Months | +$21.3k | +1.71% |
| 1 Year | -$58.3k | -4.38% |
| 3 Years | +$231k | +22.1% |
| 5 Years | +$387k | +43.7% |
| 10 Years | +$765k | +151% |
List My Property
Real Estate Statistics
Financing Solutions
Browsing History
23 Reed Dr, Ajax
1 second ago
AS SEEN ON


Are You a Licensed Real Estate Agent or Broker?