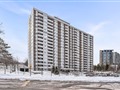
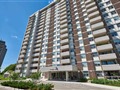
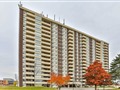
44 Falby Crt 1111
$606,406
Comparative Market Analysis
Jun 6, 2025
NOT AN ACTIVE LISTING
Historical Performance
| Period | $ Change | % Change |
| 1 Day | +$364 | +0.060% |
| 7 Days | +$325 | +0.054% |
| 30 Days | +$75 | +0.012% |
| 3 Months | -$1,235 | -0.203% |
| 6 Months | +$7,651 | +1.28% |
| 1 Year | -$29.2k | -4.59% |
| 3 Years | +$101k | +19.9% |
| 5 Years | +$178k | +41.6% |
| 10 Years | +$342k | +129% |
List My Property
Real Estate Statistics
Financing Solutions
Browsing History
25 Cumberland Lane 505, Ajax
1 second ago
25 Cumberland Lane 407, Ajax
2 seconds ago
97 Church St, Ajax
3 seconds ago
36 Harley Dr, Ajax
4 seconds ago
2198 Greenwood Rd, Ajax
5 seconds ago
2857 Greenwood Rd, Ajax
7 seconds ago
46 Hettersley Dr Bsmt, Ajax
8 seconds ago
2357 Greenwood Rd, Ajax
9 seconds ago
2200 Greenwood Rd, Ajax
10 seconds ago
34 Harley Dr, Ajax
11 seconds ago
AS SEEN ON


Are You a Licensed Real Estate Agent or Broker?