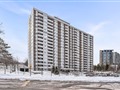
44 Falby Crt 1703
$565,475
Comparative Market Analysis
Jun 6, 2025
NOT AN ACTIVE LISTING
Historical Performance
| Period | $ Change | % Change |
| 1 Day | +$339 | +0.060% |
| 7 Days | +$352 | +0.062% |
| 30 Days | +$312 | +0.055% |
| 3 Months | -$346 | -0.061% |
| 6 Months | +$8,869 | +1.59% |
| 1 Year | -$22.9k | -3.90% |
| 3 Years | +$109k | +23.9% |
| 5 Years | +$189k | +50.4% |
| 10 Years | +$338k | +148% |
List My Property
Real Estate Statistics
Financing Solutions
Browsing History
35 Hornsell Circ, Ajax
2 seconds ago
25 Longstaff Dr, Ajax
3 seconds ago
110 Smales Dr, Ajax
4 seconds ago
76 Decourcy-Ireland Circ, Ajax
5 seconds ago
18 Beatty Rd, Ajax
6 seconds ago
31 Strickland Dr, Ajax
7 seconds ago
44 Hornsell Circ, Ajax
8 seconds ago
44 Falby Crt 206, Ajax
15 seconds ago
155 Admiral Rd, Ajax
16 seconds ago
65 Quarrie Lane, Ajax
17 seconds ago
AS SEEN ON


Are You a Licensed Real Estate Agent or Broker?