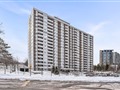
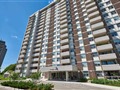
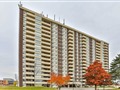
44 Falby Crt 909
$558,841
Comparative Market Analysis
Jun 6, 2025
NOT AN ACTIVE LISTING
Historical Performance
| Period | $ Change | % Change |
| 1 Day | +$335 | +0.060% |
| 7 Days | +$274 | +0.049% |
| 30 Days | -$58 | -0.010% |
| 3 Months | -$1,562 | -0.279% |
| 6 Months | +$6,139 | +1.11% |
| 1 Year | -$29.1k | -4.95% |
| 3 Years | +$84.4k | +17.8% |
| 5 Years | +$151k | +37.1% |
| 10 Years | +$311k | +126% |
List My Property
Real Estate Statistics
Financing Solutions
Browsing History
163 Admiral Rd, Ajax
1 second ago
92 Burcher Rd, Ajax
2 seconds ago
61 Beatty Rd, Ajax
3 seconds ago
43 Beatty Rd, Ajax
4 seconds ago
119 Smales Dr, Ajax
5 seconds ago
52 Smales Dr, Ajax
6 seconds ago
80 Strickland Dr, Ajax
6 seconds ago
27 Church St, Ajax
6 seconds ago
77 Decourcy-Ireland Circ, Ajax
7 seconds ago
45 Cumberland Lane 801, Ajax
7 seconds ago
AS SEEN ON


Are You a Licensed Real Estate Agent or Broker?