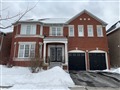
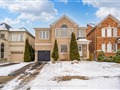
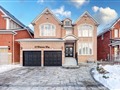
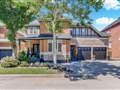
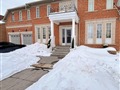
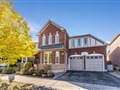
48 Morland Cres
$1,313,532
Comparative Market Analysis
Jun 6, 2025
NOT AN ACTIVE LISTING
Historical Performance
| Period | $ Change | % Change |
| 1 Day | +$364 | +0.028% |
| 7 Days | +$373 | +0.028% |
| 30 Days | -$1,554 | -0.118% |
| 3 Months | -$898 | -0.068% |
| 6 Months | +$28.8k | +2.24% |
| 1 Year | -$40.4k | -2.98% |
| 3 Years | +$289k | +28.2% |
| 5 Years | +$418k | +46.7% |
| 10 Years | +$760k | +137% |
List My Property
Real Estate Statistics
Financing Solutions
Browsing History
17 Coomer Cres, Ajax
1 second ago
9 Bradbury Cres, Ajax
2 seconds ago
16 Trawley Cres, Ajax
3 seconds ago
28 Annie Cres, Ajax
4 seconds ago
16 Gardiner Dr, Ajax
5 seconds ago
11 Telford St, Ajax
7 seconds ago
16 Annie Cres, Ajax
8 seconds ago
5 Croker Dr, Ajax
9 seconds ago
46 Darley St, Ajax
10 seconds ago
118 Clements Rd, Ajax
11 seconds ago
AS SEEN ON


Are You a Licensed Real Estate Agent or Broker?