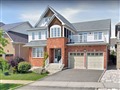
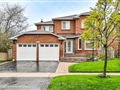
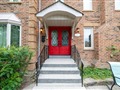
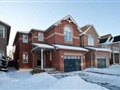
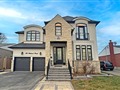
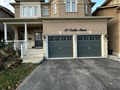
53 Marjoram Dr
$1,012,998
Comparative Market Analysis
Jun 7, 2025
NOT AN ACTIVE LISTING
Historical Performance
| Period | $ Change | % Change |
| 1 Day | +$291 | +0.029% |
| 7 Days | +$121 | +0.012% |
| 30 Days | -$2,144 | -0.211% |
| 3 Months | -$4,196 | -0.412% |
| 6 Months | +$14.0k | +1.40% |
| 1 Year | -$53.0k | -4.97% |
| 3 Years | +$153k | +17.8% |
| 5 Years | +$293k | +40.6% |
| 10 Years | +$568k | +128% |
List My Property
Real Estate Statistics
Financing Solutions
Browsing History
22 O'Dell Crt, Ajax
18 seconds ago
103 Beer Cres, Ajax
23 seconds ago
80 Rollo Dr, Ajax
28 seconds ago
8 Mccourt Dr, Ajax
33 seconds ago
61 Deacon Lane, Ajax
38 seconds ago
736 Pickering Beach Rd, Ajax
43 seconds ago
AS SEEN ON


Are You a Licensed Real Estate Agent or Broker?