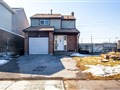
63 Salt Dr
$975,207
Comparative Market Analysis
Jul 5, 2025
NOT AN ACTIVE LISTING
Historical Performance
| Period | $ Change | % Change |
| 1 Day | +$280 | +0.029% |
| 7 Days | +$279 | +0.029% |
| 30 Days | -$1,258 | -0.129% |
| 3 Months | -$1,355 | -0.139% |
| 6 Months | +$19.3k | +2.02% |
| 1 Year | -$36.8k | -3.64% |
| 3 Years | +$198k | +25.5% |
| 5 Years | +$356k | +57.6% |
| 10 Years | +$579k | +146% |
List My Property
Real Estate Statistics
Financing Solutions
AS SEEN ON


Are You a Licensed Real Estate Agent or Broker?