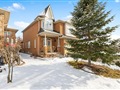
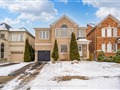
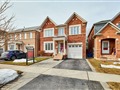
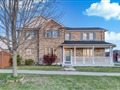
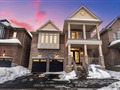
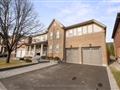
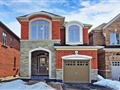
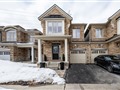
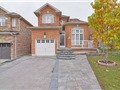
64 Morland Cres
$1,453,721
Comparative Market Analysis
Jun 6, 2025
NOT AN ACTIVE LISTING
Historical Performance
| Period | $ Change | % Change |
| 1 Day | +$403 | +0.028% |
| 7 Days | +$245 | +0.017% |
| 30 Days | -$2,589 | -0.178% |
| 3 Months | -$4,226 | -0.290% |
| 6 Months | +$24.0k | +1.68% |
| 1 Year | -$67.7k | -4.45% |
| 3 Years | +$258k | +21.6% |
| 5 Years | +$431k | +42.2% |
| 10 Years | +$866k | +147% |
List My Property
Real Estate Statistics
Financing Solutions
Browsing History
12 Telford St, Ajax
2 seconds ago
54 Darley St, Ajax
3 seconds ago
119 Dooley Cres, Ajax
4 seconds ago
Milham Dr, Ajax
5 seconds ago
97 Carpendale Cres, Ajax
6 seconds ago
62 Dooley Cres, Ajax
7 seconds ago
52 Dooley Cres, Ajax
8 seconds ago
AS SEEN ON


Are You a Licensed Real Estate Agent or Broker?