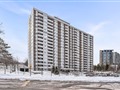
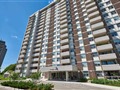
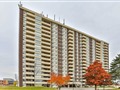
66 Falby Crt 1403
$549,750
Comparative Market Analysis
May 13, 2025
NOT AN ACTIVE LISTING
Historical Performance
| Period | $ Change | % Change |
| 1 Day | +$330 | +0.060% |
| 7 Days | +$349 | +0.064% |
| 30 Days | +$335 | +0.061% |
| 3 Months | -$258 | -0.047% |
| 6 Months | +$8,711 | +1.61% |
| 1 Year | -$22.4k | -3.91% |
| 3 Years | +$104k | +23.3% |
| 5 Years | +$185k | +50.9% |
| 10 Years | +$346k | +170% |
List My Property
Real Estate Statistics
Financing Solutions
Browsing History
28 Telford St, Ajax
1 second ago
66 Falby Crt 603, Ajax
1 second ago
80 Gregory Rd, Ajax
2 seconds ago
89 Warwick Ave, Ajax
2 seconds ago
326 Delaney Dr, Ajax
2 seconds ago
AS SEEN ON


Are You a Licensed Real Estate Agent or Broker?