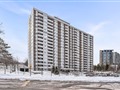
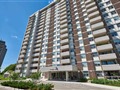
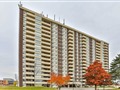
66 Falby Crt 1405
$563,449
Comparative Market Analysis
Jun 6, 2025
NOT AN ACTIVE LISTING
Historical Performance
| Period | $ Change | % Change |
| 1 Day | +$338 | +0.060% |
| 7 Days | +$369 | +0.066% |
| 30 Days | +$398 | +0.071% |
| 3 Months | -$74 | -0.013% |
| 6 Months | +$9,363 | +1.69% |
| 1 Year | -$21.8k | -3.72% |
| 3 Years | +$112k | +24.7% |
| 5 Years | +$197k | +53.8% |
| 10 Years | +$350k | +164% |
List My Property
Real Estate Statistics
Financing Solutions
Browsing History
42 Spraggins Lane, Ajax
2 seconds ago
57 Reed Dr, Ajax
2 seconds ago
AS SEEN ON


Are You a Licensed Real Estate Agent or Broker?