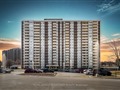
66 Falby Crt 1502
$558,727
Comparative Market Analysis
Apr 24, 2024
NOT AN ACTIVE LISTING
Historical Performance
| Period | $ Change | % Change |
| 1 Day | +$335 | +0.060% |
| 7 Days | +$347 | +0.062% |
| 30 Days | +$300 | +0.054% |
| 3 Months | -$396 | -0.071% |
| 6 Months | +$8,569 | +1.56% |
| 1 Year | -$23.4k | -4.03% |
| 3 Years | +$103k | +22.7% |
| 5 Years | +$184k | +49.2% |
| 10 Years | +$351k | +169% |
List My Property
Real Estate Statistics
Financing Solutions
AS SEEN ON

Are You a Licensed Real Estate Agent or Broker?