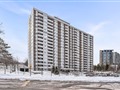
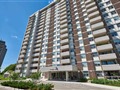
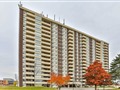
66 Falby Crt #1503
$496,416
Comparative Market Analysis
Jun 6, 2025
NOT AN ACTIVE LISTING
Historical Performance
| Period | $ Change | % Change |
| 1 Day | +$298 | +0.060% |
| 7 Days | +$369 | +0.074% |
| 30 Days | +$583 | +0.118% |
| 3 Months | +$829 | +0.167% |
| 6 Months | +$10.5k | +2.17% |
| 1 Year | -$12.3k | -2.42% |
| 3 Years | +$116k | +30.4% |
| 5 Years | +$169k | +51.8% |
| 10 Years | +$295k | +147% |
List My Property
Real Estate Statistics
Financing Solutions
Browsing History
66 Falby Crt 804, Ajax
1 second ago
75 Reed Dr, Ajax
2 seconds ago
AS SEEN ON


Are You a Licensed Real Estate Agent or Broker?