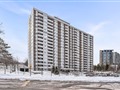
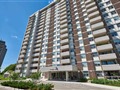
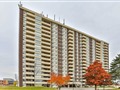
66 Falby Crt 1610
$499,948
Comparative Market Analysis
Jun 6, 2025
NOT AN ACTIVE LISTING
Historical Performance
| Period | $ Change | % Change |
| 1 Day | +$300 | +0.060% |
| 7 Days | +$313 | +0.063% |
| 30 Days | +$280 | +0.056% |
| 3 Months | -$324 | -0.065% |
| 6 Months | +$7,715 | +1.57% |
| 1 Year | -$20.9k | -4.02% |
| 3 Years | +$92.0k | +22.5% |
| 5 Years | +$164k | +48.9% |
| 10 Years | +$317k | +174% |
List My Property
Real Estate Statistics
Financing Solutions
Browsing History
84 Beverton Cres, Ajax
1 second ago
AS SEEN ON


Are You a Licensed Real Estate Agent or Broker?