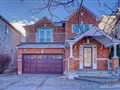
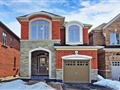
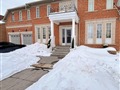
72 Morland Cres
$1,306,011
Comparative Market Analysis
Jun 6, 2025
NOT AN ACTIVE LISTING
Historical Performance
| Period | $ Change | % Change |
| 1 Day | +$362 | +0.028% |
| 7 Days | +$336 | +0.026% |
| 30 Days | -$1,727 | -0.132% |
| 3 Months | -$1,578 | -0.121% |
| 6 Months | +$27.0k | +2.11% |
| 1 Year | -$45.0k | -3.33% |
| 3 Years | +$281k | +27.4% |
| 5 Years | +$425k | +48.3% |
| 10 Years | +$762k | +140% |
List My Property
Real Estate Statistics
Financing Solutions
Browsing History
66 Hornsell Circ, Ajax
1 second ago
668 Shoal Point Rd, Ajax
2 seconds ago
53 Stockbridge Cres, Ajax
3 seconds ago
38 Hornsell Circ, Ajax
4 seconds ago
23 Wheatley Cres, Ajax
5 seconds ago
65 Middlecote Dr, Ajax
6 seconds ago
9 Trawley Cres, Ajax
7 seconds ago
34 Torr Lane, Ajax
8 seconds ago
34 Peacock Cres, Ajax
9 seconds ago
1077 Shoal Point Rd, Ajax
10 seconds ago
AS SEEN ON


Are You a Licensed Real Estate Agent or Broker?